
Report: Gap Between APS School Achievement Doubles
November 27, 2016
Using Academic Performance Reports from 1973-2002 obtained from the Arlington Center for Local History and SAT reports from Arlington Public Schools website Crossed Sabres was able to analyze historical trends in SAT achievement across the three Arlington High Schools. Before our key findings a couple of notes: SAT data from 2012-2016 was calculated by dividing the score by three and then subtracting that number from the total due to the addition of a third section of the SAT. For example a perfect score of 2400 on the new SAT would be divided by three to yield 800 and then when subtracted from 2400 would yield 1600, a perfect score on the past SAT with two sections. Additionally, Crossed Sabres was not able to obtain data from 2003-2011 despite requesting it from the school board.
Executive Summary
The report has a number of key findings:
- W-L has cut it’s gap in achievement with Yorktown by 40%
- Wakefield has doubled it’s achievement gap with Yorktown increasing by 109%
- Wakefield has tripled it’s achievement gap with W-L increasing by 280%
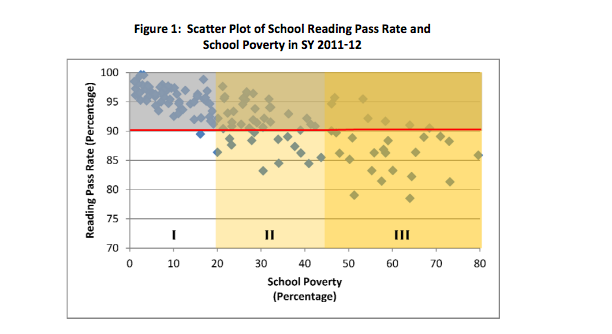
Although the report cannot prove causation, after analyzing the data with historical boundary changes and related studies, the data would suggest that economic factors play a large role in the achievement gap. This is seen from 1983-1987 when redistricting implemented over four years moved higher income neighborhoods from W-L to Yorktown the gap widens again. In 1988 the redistricting of comparatively higher income Halls Hill to Yorktown marks another widening of the gap. In 1997 onward, the current boundaries were put into effect, however, due to the concentration of lower-income housing in South Arlington. A study conducted by Fairfax Public Schools has found that when a school is past a 45 percent free and reduced lunch threshold they are very unlikely to perform. A section from their summary reads “Almost all schools with poverty levels of 45 percent or higher were unable to reach expected pass rate levels in reading or math. Follow‐up statistical analyses found statistical evidence that two tipping points exist in FCPS. The reading data provided the most consistent findings as it indicated two tipping points occurring at 20 and 40‐45 percent school‐level poverty. Thus, FCPS schools with greater than 20 percent poverty are much less likely to meet performance expectations than those with less than 20 percent poverty. And, once poverty levels at a school reach 40 percent or more, FCPS schools are unlikely to meet expectations for school performance.” I have provided their in the chart below. Ever since the 96-97 boundary changes Wakefield has been pushed over the 45 percent free and reduced lunch tipping point and scores appear to have stagnated since.
Historical Context
This page shows the historical context for all four interactive graphs.
Interactive Graphs
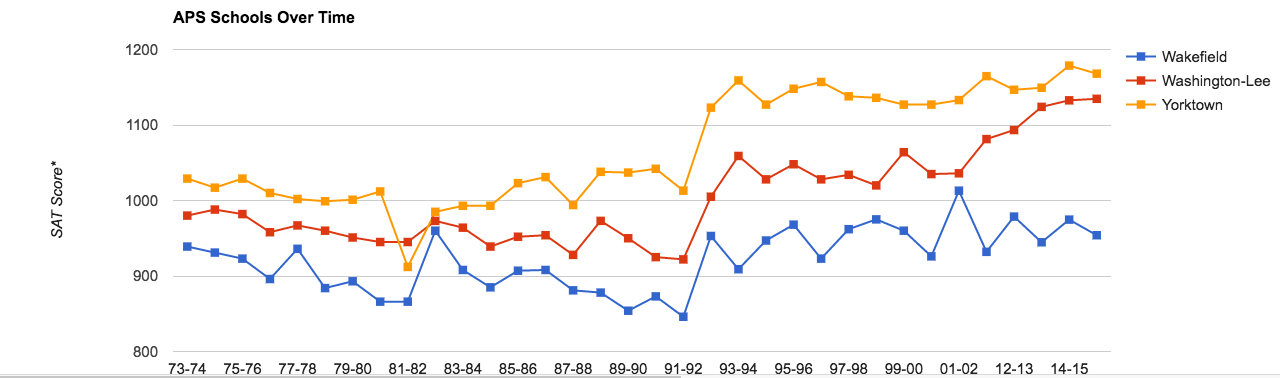
This section shows the graphs with all the data collected. The first graph shows the raw scores over time. *Note that scores from 2011-12 onward were calculated by dividing the original score by three and then subtracting that from the original to account for the addition of a third section to the SAT. The next three graphs show the percent gap between the three schools over time. This was calculated by subtracting Wakefield or Washington-Lee’s score from Yorktown’s and then dividing that number by Yorktown’s.
Appendix
Here you will find the photos of the Academic Reports the data was retrieved from as well as a link to the spreadsheet that shows all the raw data.
Photos: https://goo.gl/photos/C4GEn4rSyknmZ1Gz7