

APS Boundary Demographic Report
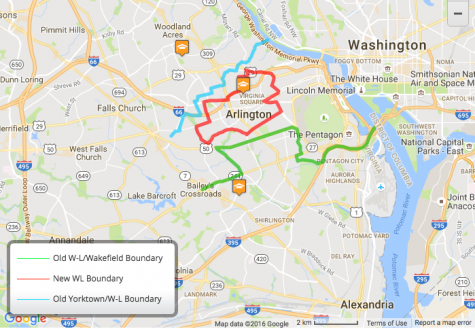
With the final Washington-Lee boundary changes being decided on December 1st and the public feedback form closing tomorrow we decided to crunch the numbers on the proposed changes to Washington-Lee’s boundaries in this report. The report includes changes in free and reduced lunch population, population totals, as well as middle school distributions. The numbers were taken from the demographic data provided from Arlington Public Schools’ (APS) presentation on their website as well as their free and reduced lunch data from their website as well. Below you will find two infographics and one excel sheet. The first is an overview of the effect each proposed boundary plan will have on the school, the second is an in depth look at each proposed boundary change and the last excel sheet shows the data and methodology for finding these numbers. If you click on or hover above each data set with your cursor it will tell you the exact data or percentage as seen in the image below. If you are viewing this through a mobile device it will be easier in landscape orientation. If you need any clarification on what the graphs mean do not hesitate to comment and we will respond as fast as possible.
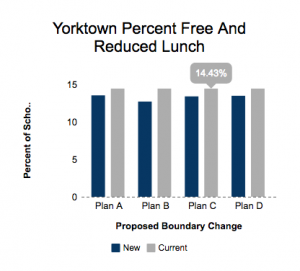
Note: The numbers from the presentation are projected enrollment numbers made in early 2016 by APS, these numbers have already proven to be 200 students or about 19.46% lower then projected for the 2016-2017 school year.


adviser • Nov 7, 2016 at 3:39 PM
I asked Assistant Superintendent Linda Erdos about including civil rights statistics and she replied “For the purpose of boundaries, demographics has been defined as students eligible for free and reduced-price lunch. It does not include the Civil Rights statistics as part of the definition for diversity. Over the past 20+ years, there have been a number of lawsuits and federal court rulings that suggest that using racial or ethnic differences is not an acceptable basis for changing boundaries. Therefore, we are looking only at economic indiators.” Therefore, civil rights data is not included in this report.
Zarathustra • Nov 7, 2016 at 3:02 PM
But the FARM data doesnt reflect the demographics of Wakefield, high in black and hispanics. Compared to W&L. Who would agree to have their daughters redistricted to Wakefield from W&L so APS can pad the stats and make Wakefield look like it us performing better. I want my daughters to not be part of this social experiment. Vote out the incumbent board!